
Having lived in San Francisco both then and now I can say it does all look and feel familiar.


Via Finanz Und Wirtschaft,
William White is worried. The former chief economist of the Bank for International Settlements is highly sceptical of the ultra loose monetary policy that most central banks are still pursuing. "It all feels like 2007, with equity markets overvalued and spreads in the bond markets extremely thin", he warns.
Mr. White, all the major central banks have been running expansive monetary policies for more than five years now. Have you ever experienced anything like this?
The honest truth is no one has ever seen anything like this. Not even during the Great Depression in the Thirties has monetary policy been this loose. And if you look at the details of what these central banks are doing, it’s all very experimental. They are making it up as they go along. I am very worried about any kind of policies that have that nature.But didn’t the extreme circumstances after the collapse of Lehman Brothers warrant these extreme measures?
Yes, absolutely. After Lehman, many markets just seized up. Central bankers rightly tried to maintain the basic functioning of the system. That was good crisis management. But in my career I have always distinguished between crisis prevention, crisis management, and crisis resolution. Today, the Fed still acts as if it was in crisis management. But we’re six years past that. They are essentially doing more than what they did right in the beginning. There is something fundamentally wrong with that. Plus, the Fed has moved to a completely different motivation. From the attempt to get the markets going again, they suddenly and explicitly started to inflate asset prices again. The aim is to make people feel richer, make them spend more, and have it all trickle down to get the economy going again. Frankly, I don’t think it works, and I think this is extremely dangerous.

Bitcoin And Gold
Only in a bull market could an online “currency” dubbed bitcoin surge 100-fold in one year, as it did in 2013. The phenomenon spurred The Wall Street Journal to call it a “cryptocurrency” craze, with dozens of entrants. Bitcoin now has an estimated market “value” in excess of $6 billion, leaving alphacoin, fastcoin, gridcoin, peercoin, and Zeuscoin in its wake. Now most sell-side firms are rushing to provide research on this latest fad, while “bitcoin funds” are being formed. Recent recruitment e-mails to staff such a platform reassure that even though experience is preferred, it is not required.
While bitcoin is yet another bandwagon we are happy to let pass us by, the thinking behind cryptocurrencies may contain a kernel of rationality.
If paper currencies – dollars and yen – can be printed in essentially unlimited volumes, and just as with all currencies are only worth what recipients on any given day will exchange in goods or services, then what makes them any better than the “crypto” kind of money? The dollars and yen are, of course, legal tender issued by governments, but in an era in which governments are neither popular nor trusted, that is not necessarily a big plus.
Gold, at least, has been regarded as “money,” for thousands of years, and it is relatively stable and widely accepted store of value and medium of exchange. It’s a well-known monetary “brand.” It doesn’t exist only (or at all) in cyberspace, and it cannot be printed on the whim of authorities. Ironically and perplexingly, while gold, the hard money alternative to the printing press kind of money, dropped 28% in 2013, the untested and highly speculative bitcoin went completely through the roof.And this is why the Gold Bullion Debit Card has much greater potential around the world than Bitcoin. Gold has a history as money that no other currency can match. Enabling it to be "spent" through a debit card will make it nearly universal as a method of payment.
 Around
the world, people see central banks printing money at historic rates
and devaluing their own currencies. As a result, consumers are
responding by buying physical gold as a store of value proven to be
money for thousands of years.
Around
the world, people see central banks printing money at historic rates
and devaluing their own currencies. As a result, consumers are
responding by buying physical gold as a store of value proven to be
money for thousands of years.

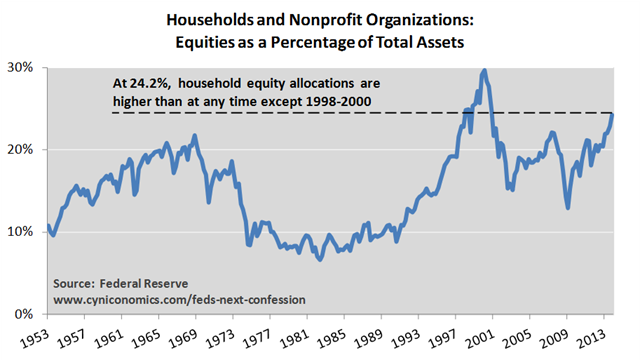
And finally, from Cyniconomics blog:In his speech in Mexico City, Fisher said some indicators like the price-to-projected forward earnings, price-to-sales ratios and market capitalization as a percentage of GDP, are at levels not seen since the dot-com boom of the late 1990s.
He noted that margin debt is pushing up against all-time records.
"We must monitor these indicators very carefully so as to ensure that the ghost of 'irrational exuberance' does not haunt us again," Fisher said. While a few Fed officials have mentioned unease about stock prices, Fisher's comments are the most pointed to date.
Fisher did not spare the bond market, saying that narrow spreads between corporate and Treasury debt "reflect lower risk premia on top of already abnormally low nominal yields."

First-time buyers, who usually represent 40 percent of the market, have been falling steadily out of the market, especially lately, with the surge in mortgage rates. While this annual report puts them at a 38 percent share, the Realtors' September home sales report shows they bought just 28 percent of the homes sold in the month.She also notes the importance of first time buyers to the economy, beyond the real estate market:
First-time buyers are also considered instrumental to a recovery historically, because they create the move-up market, but investors, largely using cash, have replaced them.Those first time buyers buy furniture, appliances and household goods. We should be seeing the millenials, a large demographic cohort buying new homes in large numbers. Unfortunately, many are unemployed and living with their parents. And in the video below you'll learn the number of first time buyers is still declining

One of the biggest accomplishments of the president, in his own words, is managing to push the official (U-3) unemployment rate, from its post-Lehman high of 10% hit in October 2009 to only 6.6% as of January 2014 as Friday's jobs report revealed. This rapid drop in unemployment - call it the "Obama Recovery" - caught none other than the Fed completely unaware, whose 6.5% unemployment rate tightening threshold is now in tatters, as it the credibility of the Fed's forward guidance as the Fed will have no choice but to scrap all unemployment QE ending, rate hiking "thresholds" at its next FOMC meeting.
So what happened to the unemployment rate that it dropped so fast it surprised and embarrassed even the "venerable" Federal Reserve, which had initially expected a 6.5% unemployment rate some time in 2015. To get the answer we go back in time to the last (and only previous) time when the US unemployment rate dropped from roughly 10%, which was in June 1983, to 6.6%, which took place three and half years later, in December 1986 - let's call it the "Reagan Recovery" in short.
Here is how the old normal compares to the "New Normal."
So far so good: one can expect the "Obama Recovery" from the Great Financial Crisis to take a little bit longer than "Reagan's."
- US unemployment dropped from 10.1% to 6.6% between June 1983 and December 1986: an interval of 43 months.
- US unemployment dropped from 10.0% to 6.6% between October 2009 and January 2014: an interval of 52 months.
But what about the internals. This is where things start getting weird.
First, we look at the number of actual jobs added (according to the Establishment survey) from the 10% point at the peak to the 6.6% at the bottom. What we find is that despite the US workforce being over 30% larger today than it was 28 years ago, it took far less actual jobs created to drop the unemployment rate by 3.4%. Specifically, while the "Reagan Recovery" resulted in the creation of 10.5 million jobs, the "Obama Recovery" achieved the same low unemployment rate with only 7.5 million jobs added.
The difference between the Old and New Normal is even more acute when one looks at the change in average monthly job gains over the "recovery" period: as noted, in 1986 the duration of the rate drop period was 43 months, where currently it has taken 52 months. This means that the Obama recovery has resulted in just 145K job additions on average per month while the unemployment rate has dipped from 10.0% to 6.6%, compared to the far more impressive 244K - and indicative of a real recovery - that marked the 1983-1986 period.
However, nowhere is the distinction more acute when comparing the two "recoveries", then when one looks at the underlying population and labor force trends.
First, here is what a normal recovery looks like: during the Reagan Years, the Civilian, Non-institutional population - or the total number of Americans eligible for work whether they are part of the labor force or not - increased by 7.4 million, while the labor force increased by 6.7 million - as close to a linear relationship as possible, and also a correlation which any rational person would expect.
So how about the Obama recovery: well, we find that between October 2009 and January 2014, the civilian, non-institutional population rose by 10.4 million, to be expected considering the far greater general population of the US - it is also a number which, on average, increases by about 230K or so every month. So what about the labor force? It is here that things get zany (as we predicted they would many years ago), because it is here that the Obama Recovery has somehow only managed to add a paltry 1.7 million people to the workforce: from 153.8 million to 155.5 million!
Of course, the above unleashes the avalanche of "demographic" excuses which we have all grown to know and laugh at, because when economists can't explain something, they promptly fall back to patently false "justifications" - recall that as we explained the collapse in the labor force has very little to do with demographics, something which the BLS itself thought as recently as 2004 when it projected a rising labor force participation into the coming years only to readjust it lower in the coming years.
The real reason for this ongoing collapse in the labor force, is the same that the CBO used to explain why - in politically correct terms - Obamacare will adversely impact the labor force over the next decade: Americans will have to earn less to get full coverage, or said otherwise, they are less incentivized to work more. This is precisely the US welfare state at work, and when one extends the Obamacare "rationale" one sees that the administration's core goal is to make increasingly more people reliant on handouts than on labor, as we explained in "When Work Is Punished: The Tragedy Of America's Welfare State" in which we showed why "for increasingly more in America, it is more lucrative to sit, do nothing, and collect various welfare entitlements, than to work" as can be seen in the "welfare cliff" charts below (source).
Alas, that is the real reason why the labor force collapse continues and will continue even as America enters its next recession. Or depression.
So what happens when one renormalizes the unemployment rate calculation and uses a 30 year average labor force participation rate as a constant instead of a variable to be plugged by the BLS to goalseek a desired result? This happens:
What the chart above shows is that the "real" unemployment rate in October 2009 was 11.2%. Where is it now? 11.1%.
And there is your "Obama Recovery", when stripped of all the fancy veneer and TOTUSed propaganda, right there.
Submitted by Michael Snyder of The Economic Collapse blog,The death of the middle class in America has become so painfully obvious that now even the New York Times is doing stories about it. Millions of middle class jobs have disappeared, incomes are steadily decreasing, the rate of homeownership has declined for eight years in a row and U.S. consumers have accumulated record-setting levels of debt. Being independent is at the heart of what it means to be "middle class", and unfortunately the percentage of Americans that are able to take care of themselves without government assistance continues to decline. In fact, the percentage of Americans that are receiving government assistance is now at an all-time record high. This is not a good thing. Sadly, the number of people on food stamps has increased by nearly 50 percent while Barack Obama has been in the White House, and at this point nearly half the entire country gets money from the government each month. Anyone that tries to tell you that the middle class is going to be "okay" simply has no idea what they are talking about. The following are 28 signs that the middle class is heading toward extinction...


